Why We Built the Most Data-Driven Real Estate Site in the Triangle

When we set out to build caseymako.com, we had a simple goal: give Triangle home buyers, sellers, and investors access to the same caliber of market data that institutional investors use — without the jargon, paywalls, or complexity. After months of development, we're proud to say we've built something truly special.
Here's what makes our platform different from every other real estate website in the Triangle.
Live Neighborhood Data — Not Stale MLS Summaries
Most real estate sites show you listing counts and average prices pulled from MLS snapshots. We go deeper. Our platform queries county public records directly — Wake, Durham, Orange, and Chatham — to compute real-time statistics on any of the 1,500+ neighborhoods in the Triangle.
Search any subdivision and you'll get:
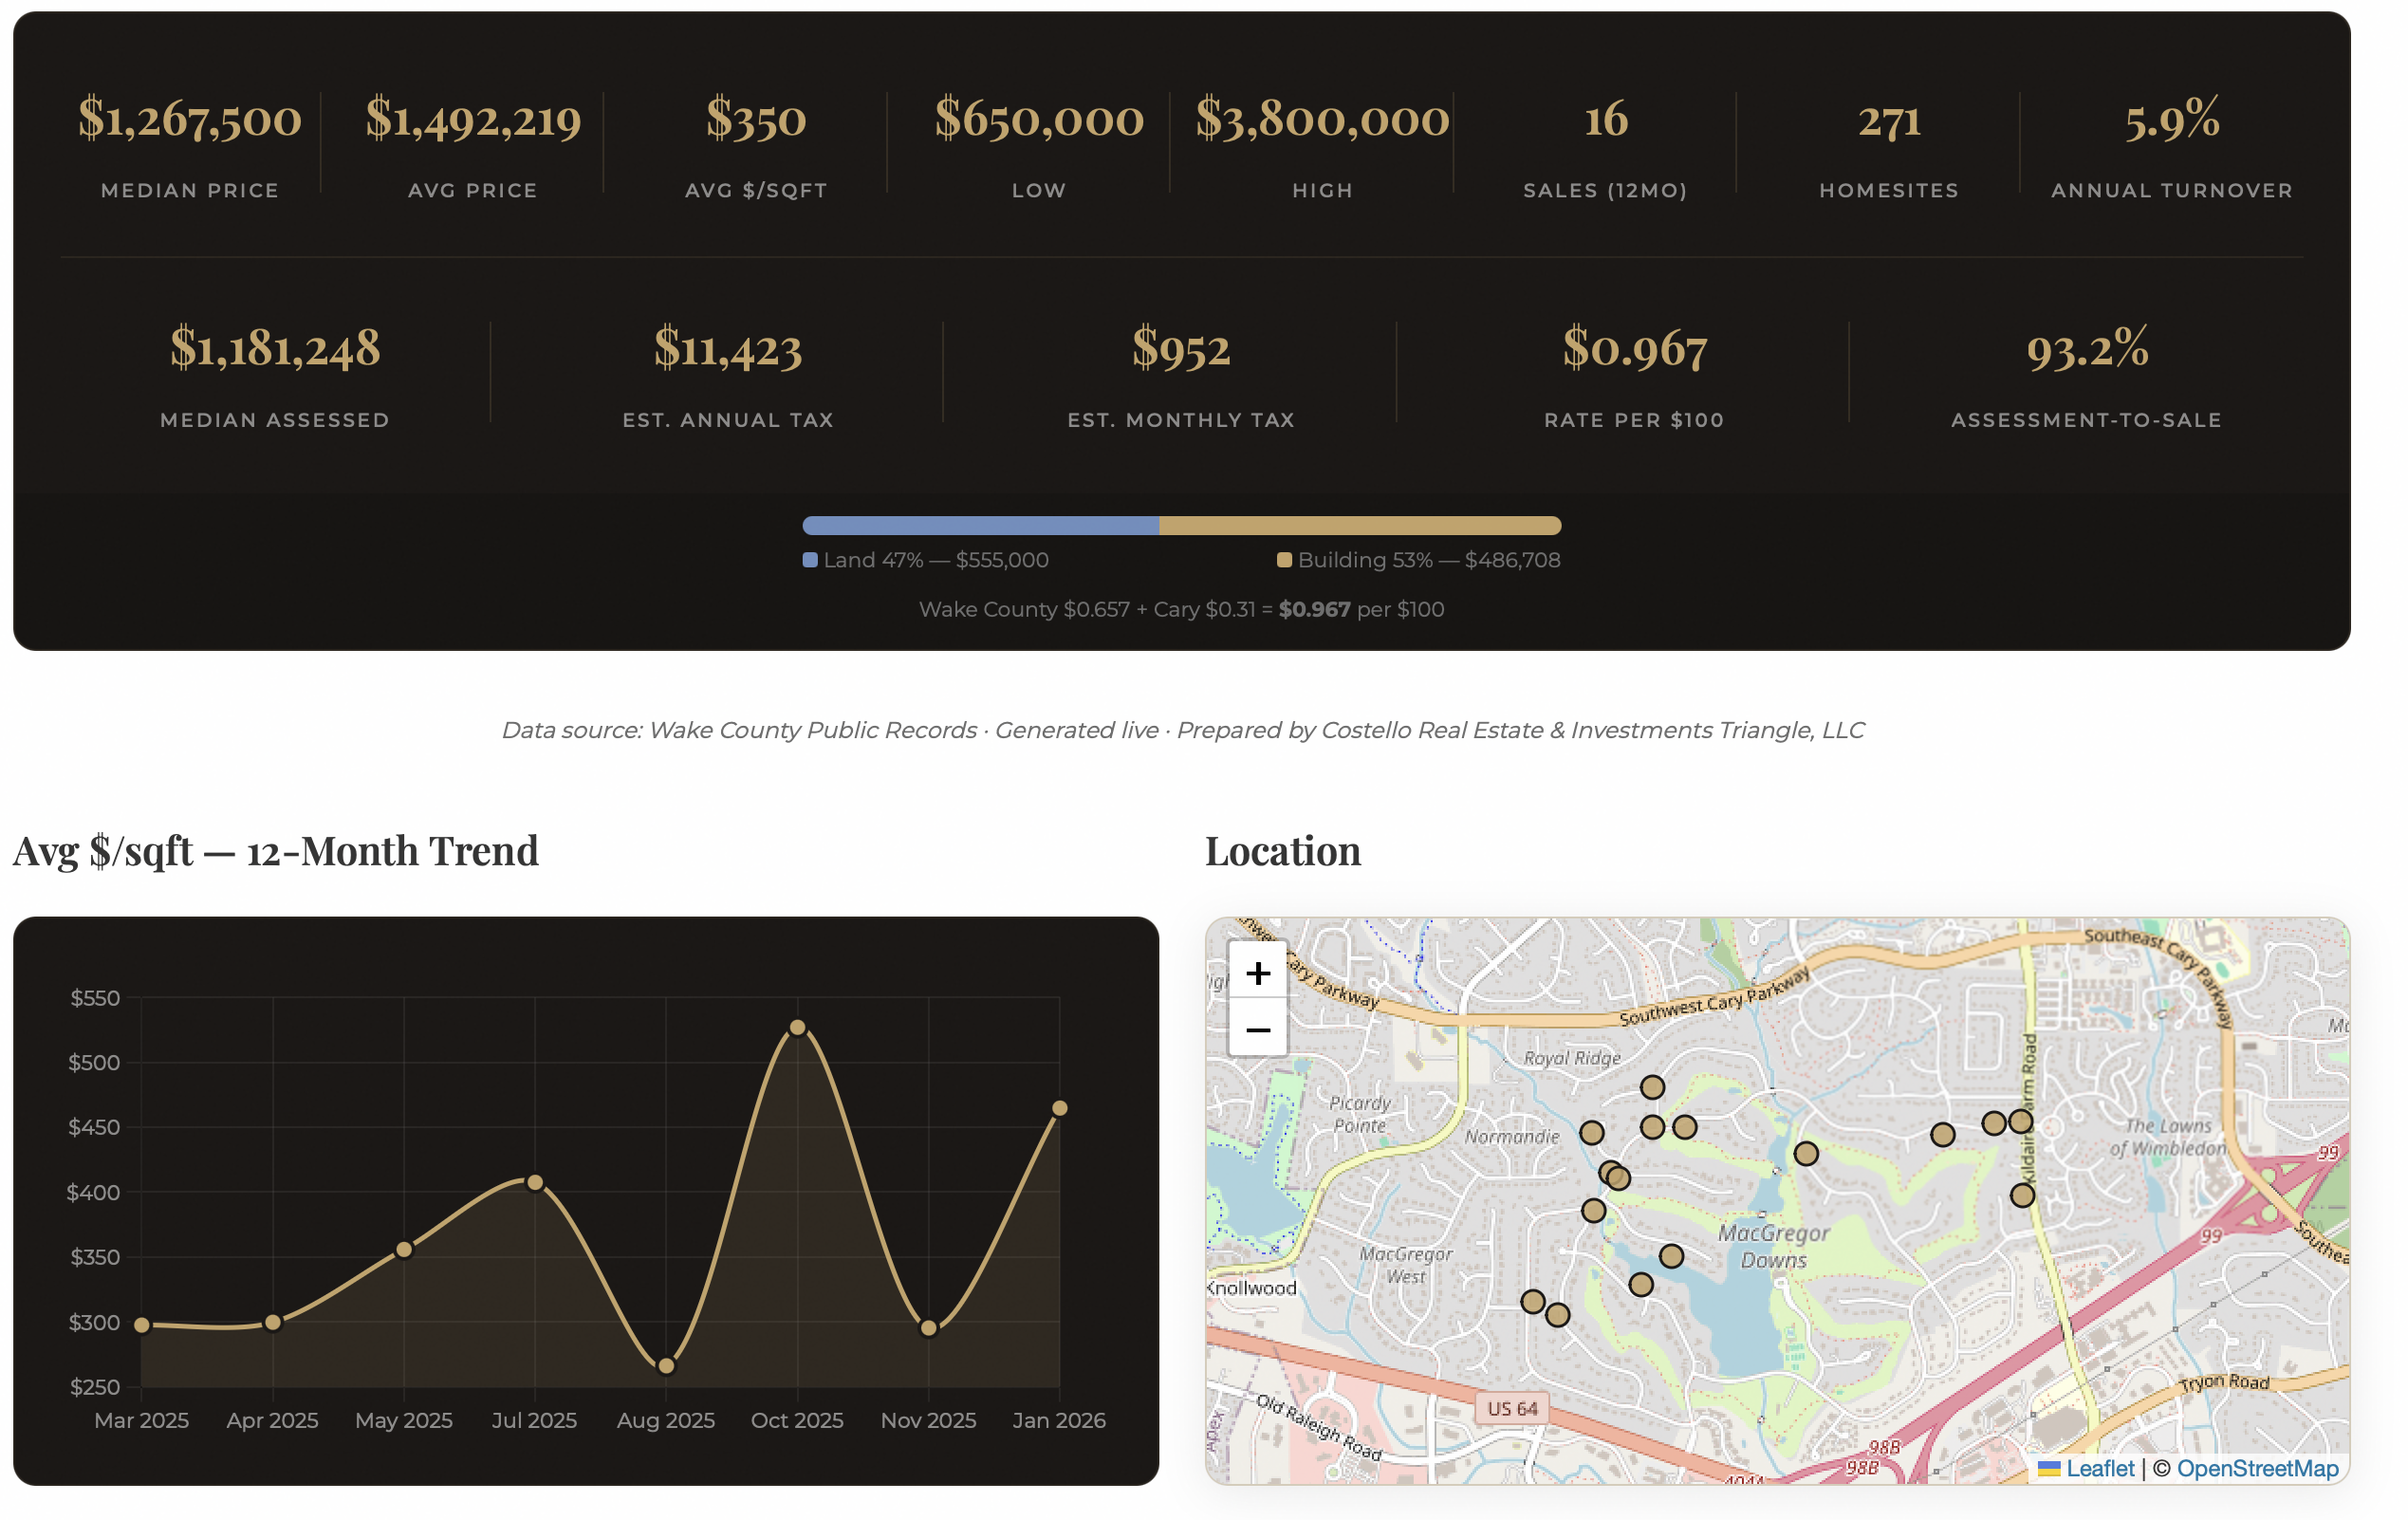
- Median sale price and price per square foot — based on actual closed sales, not asking prices
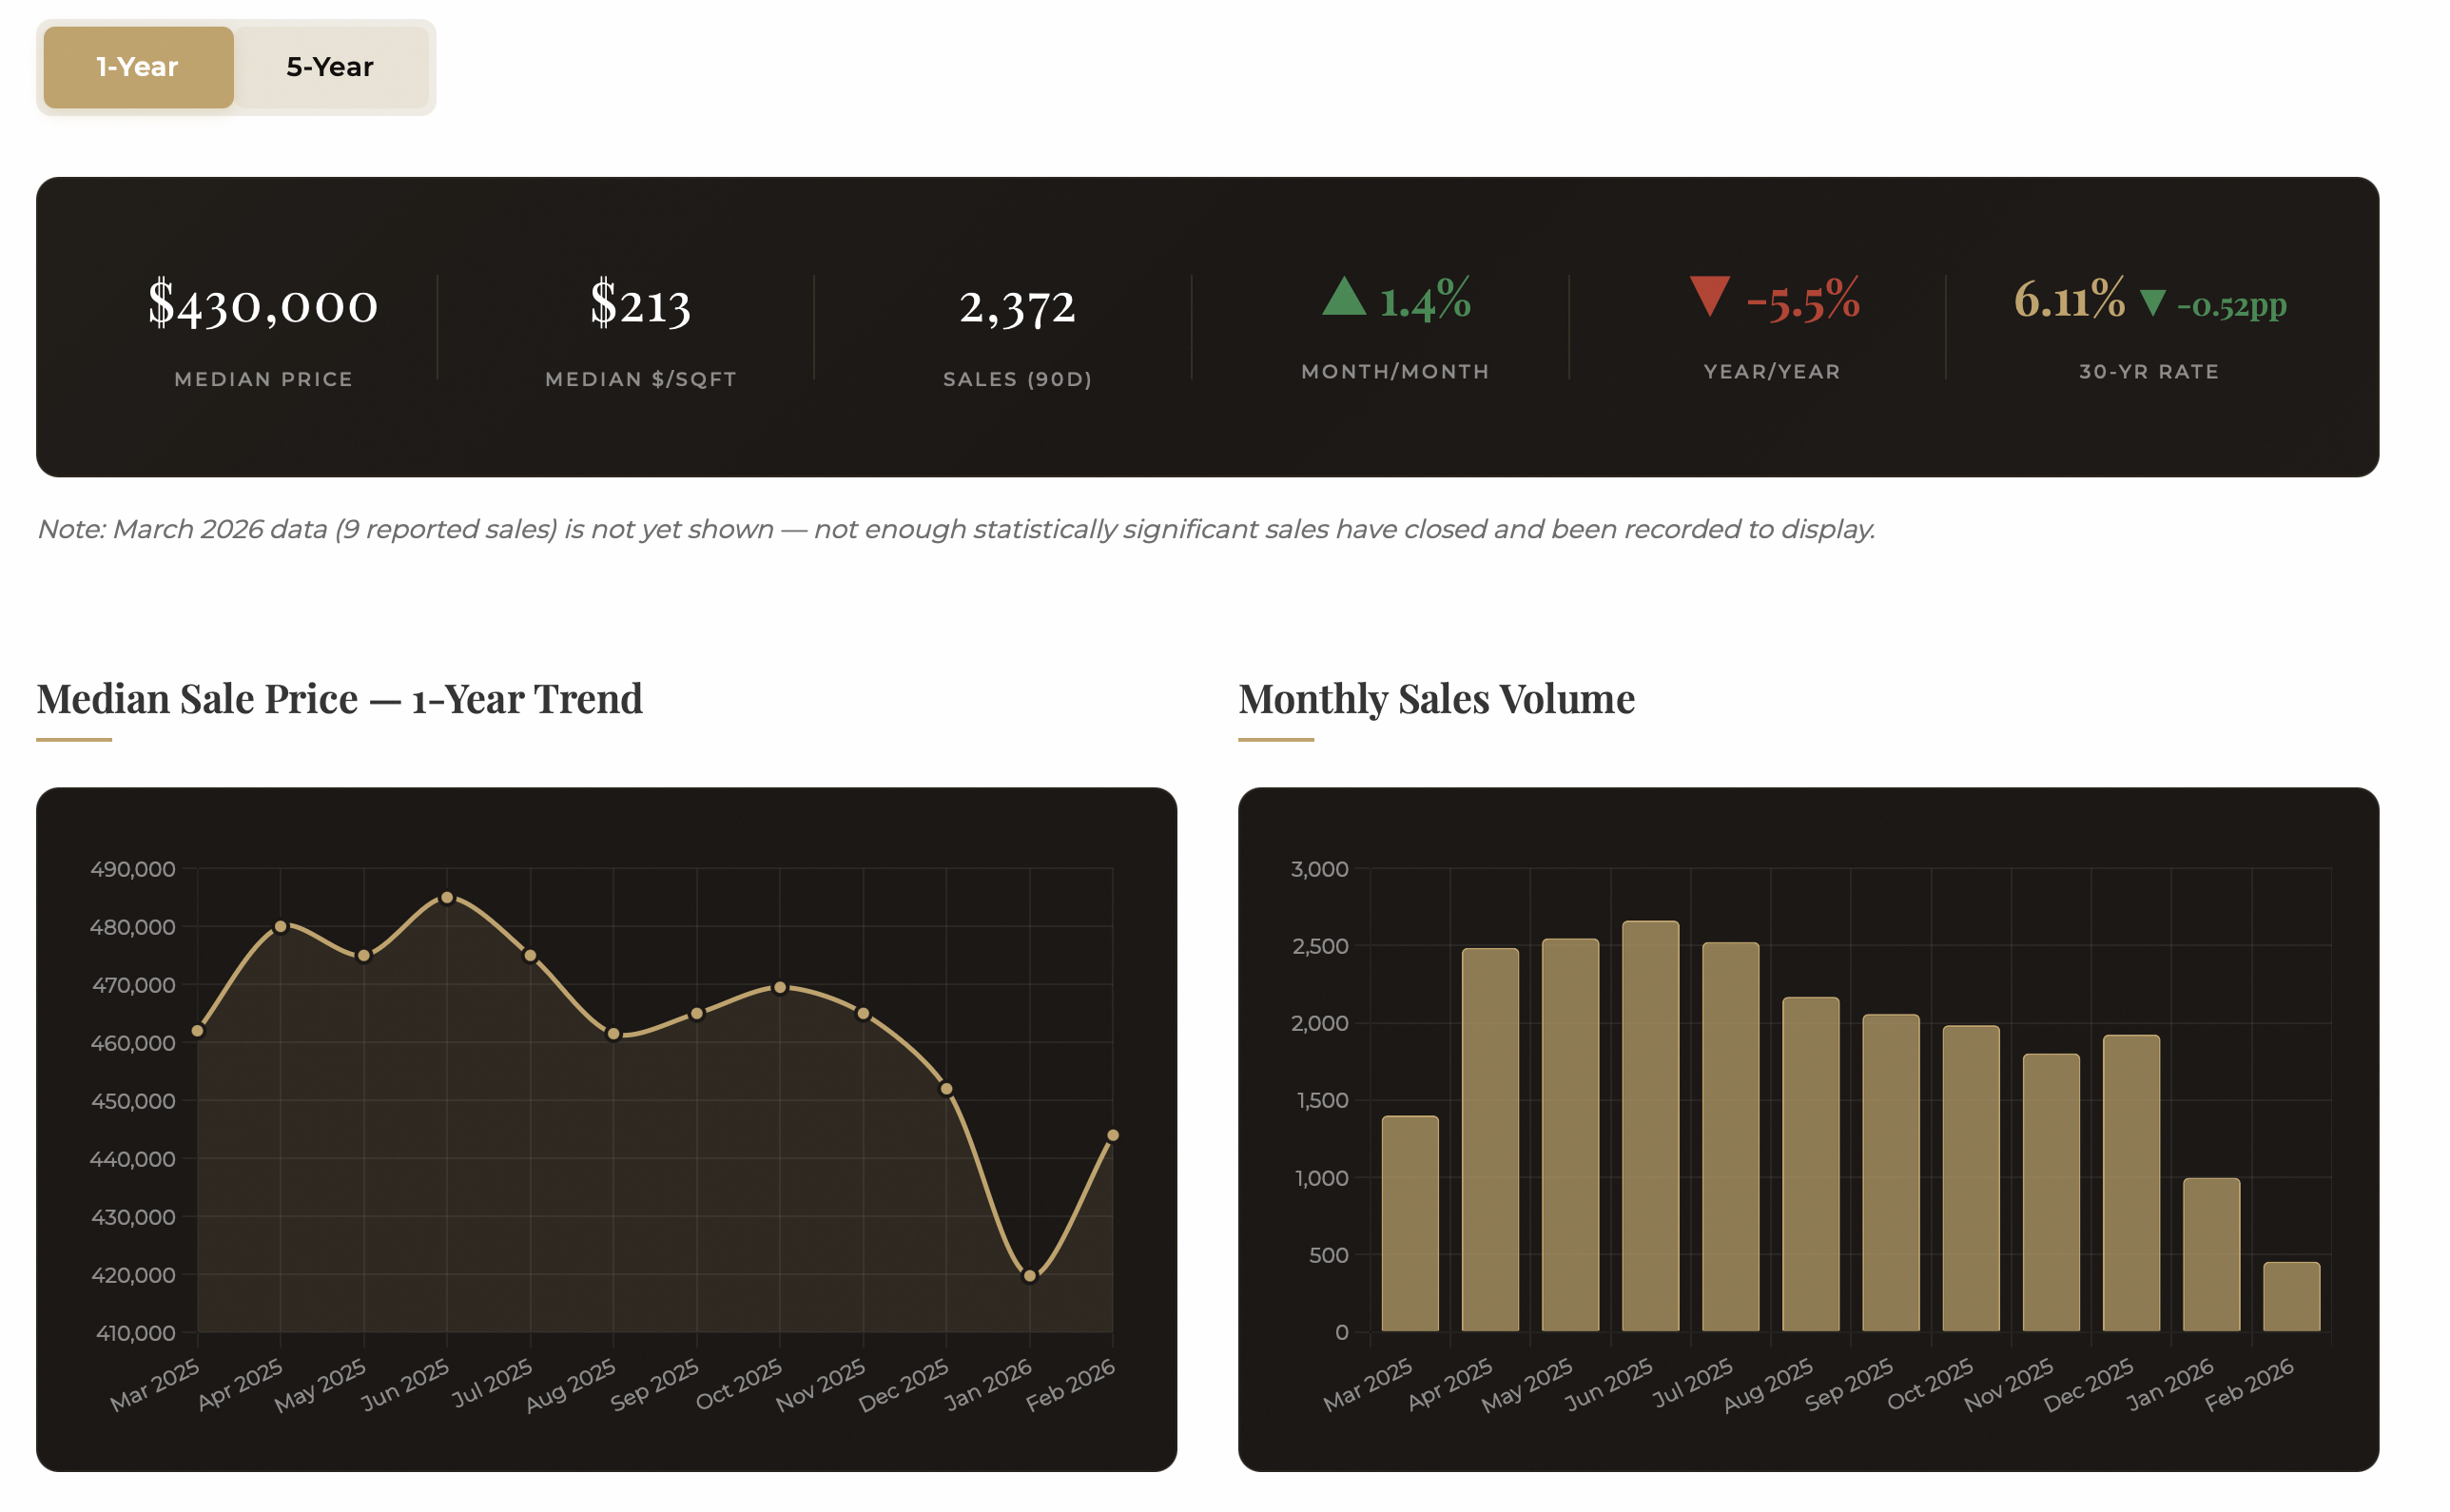
- 12-month price trends — see how $/sqft has moved month by month
- Tax assessment analysis — how assessed values compare to sale prices, what your estimated tax bill would be
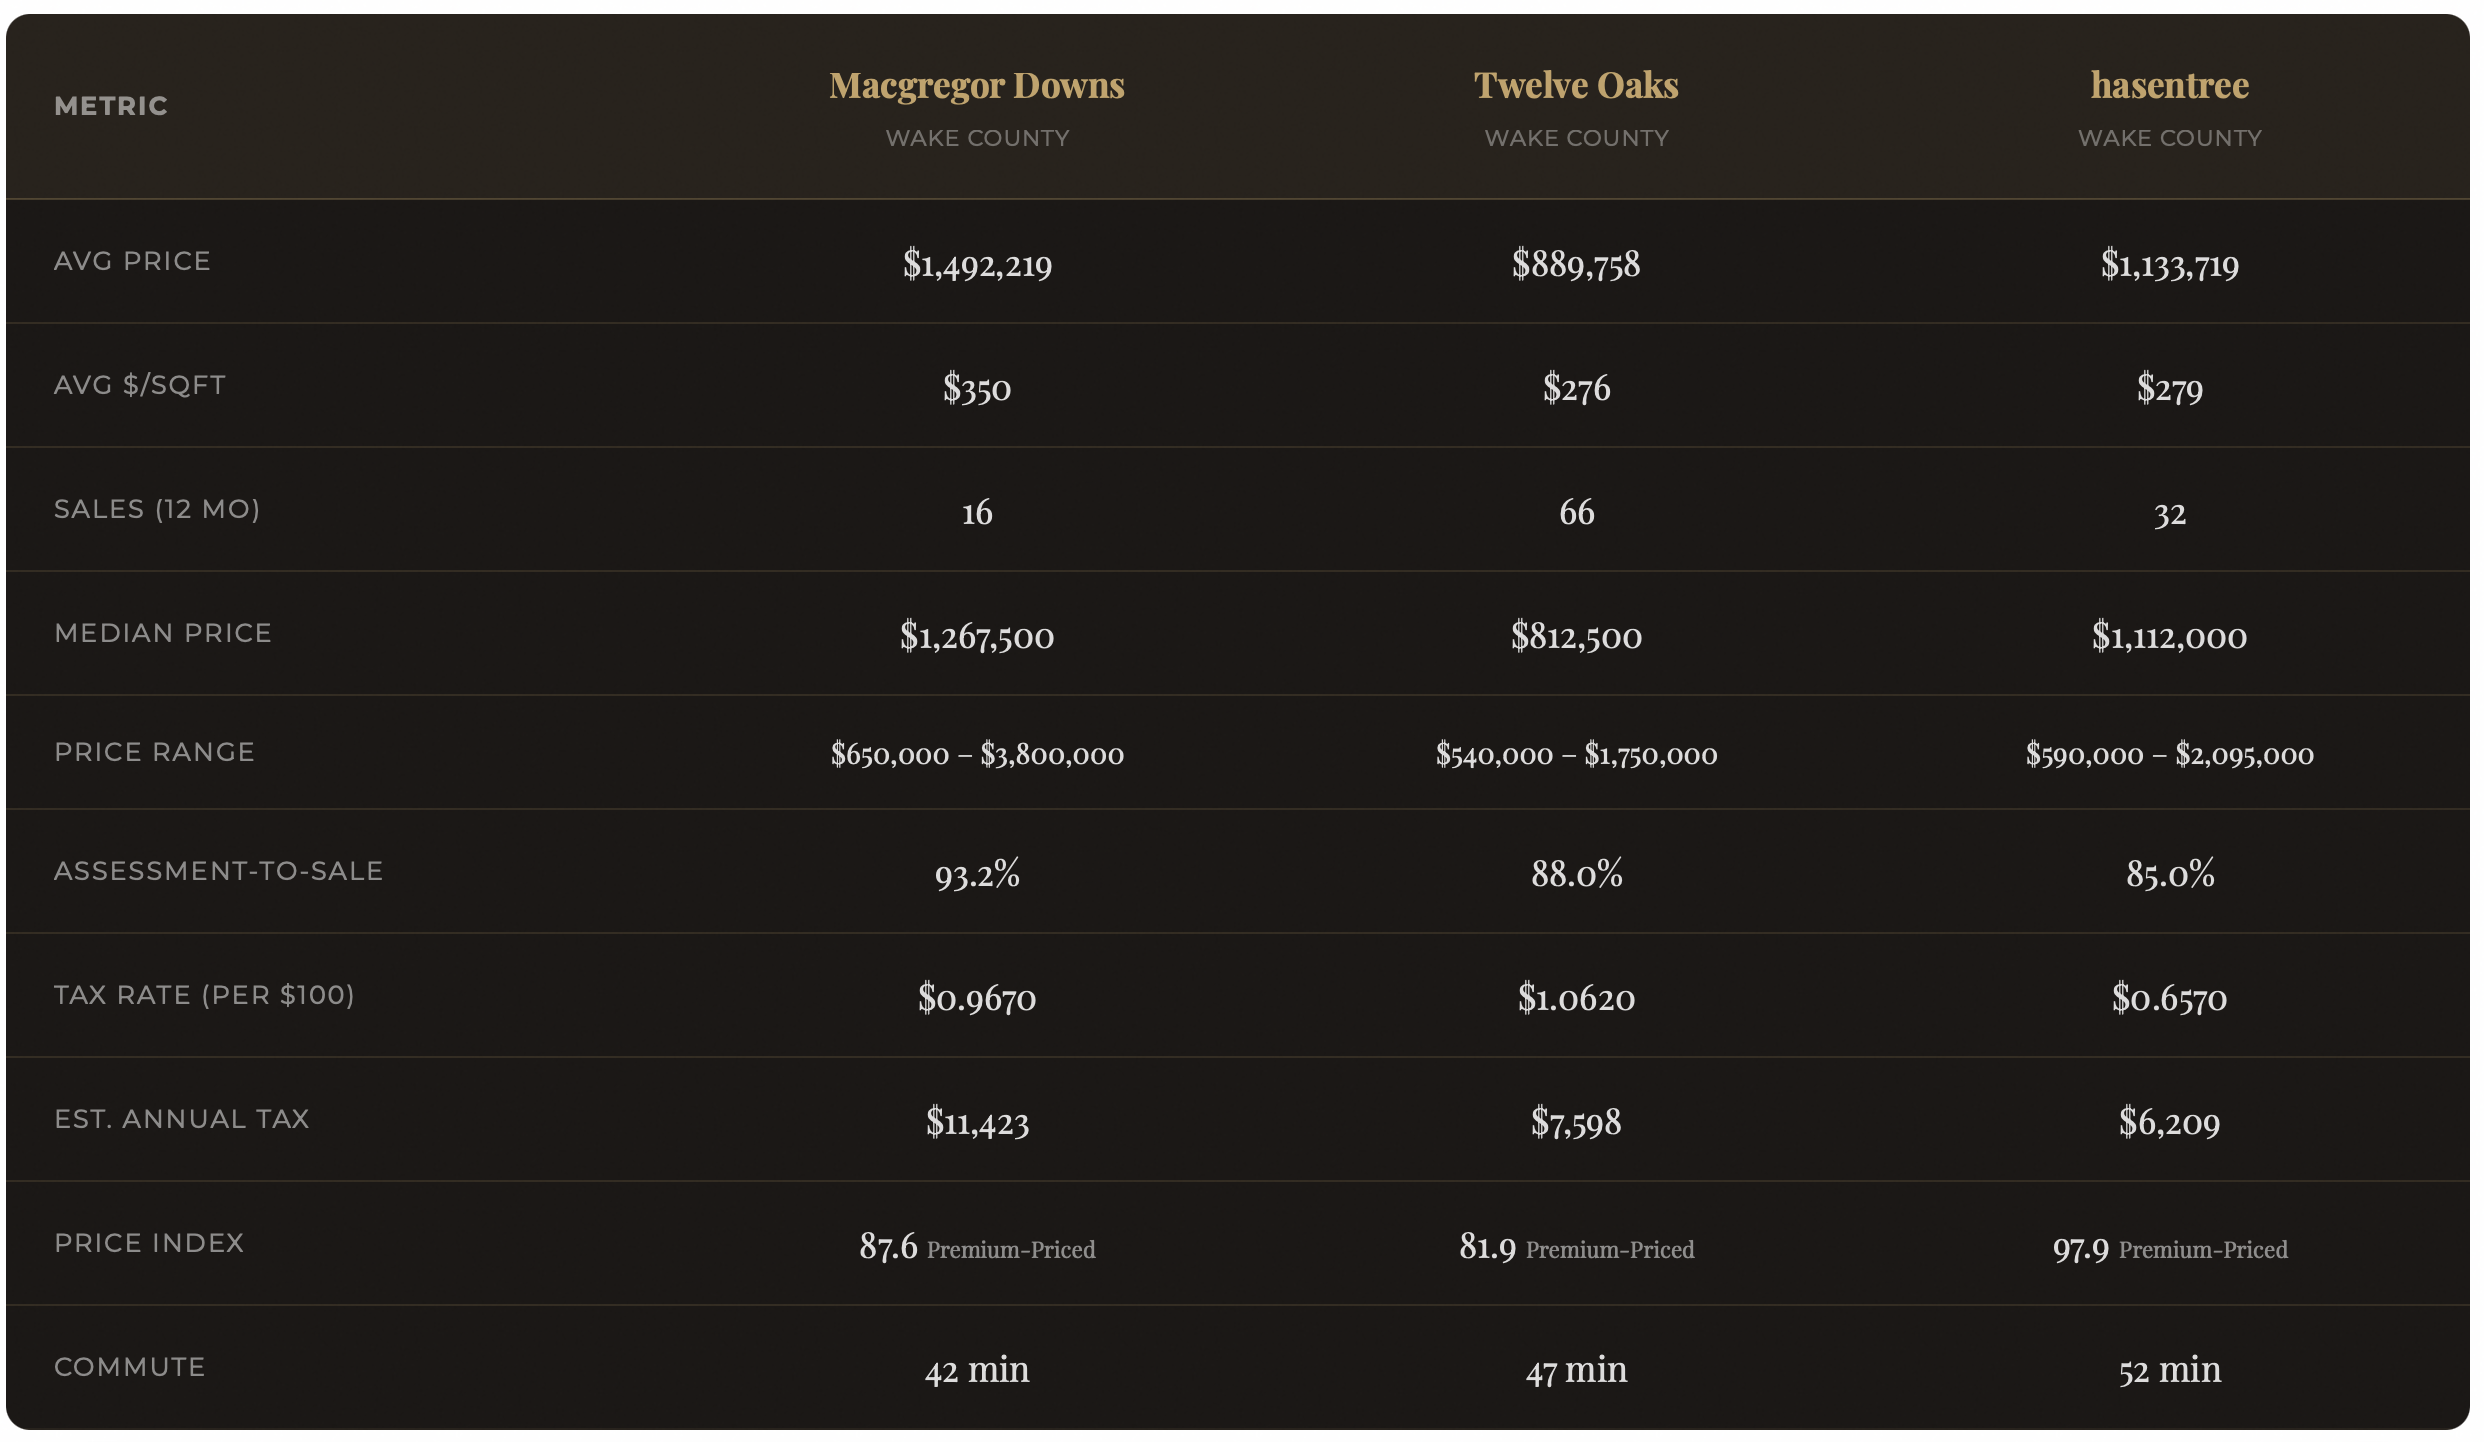
- Neighborhood comparisons — compare any two neighborhoods side-by-side
This isn't data we buy from a third party. It's computed live, every time you search, from the same county records that appraisers and tax offices use.
The Neighborhood Explorer — 1,500+ Neighborhoods at Your Fingertips
Our Neighborhood Explorer is a sortable, filterable table of every active neighborhood in the Triangle. Sort by median price, price per square foot, tax rate, assessment ratio, or market momentum. Filter by county, price range, or momentum score. It's the most comprehensive neighborhood comparison tool available for the Raleigh-Durham market.
Every neighborhood includes:
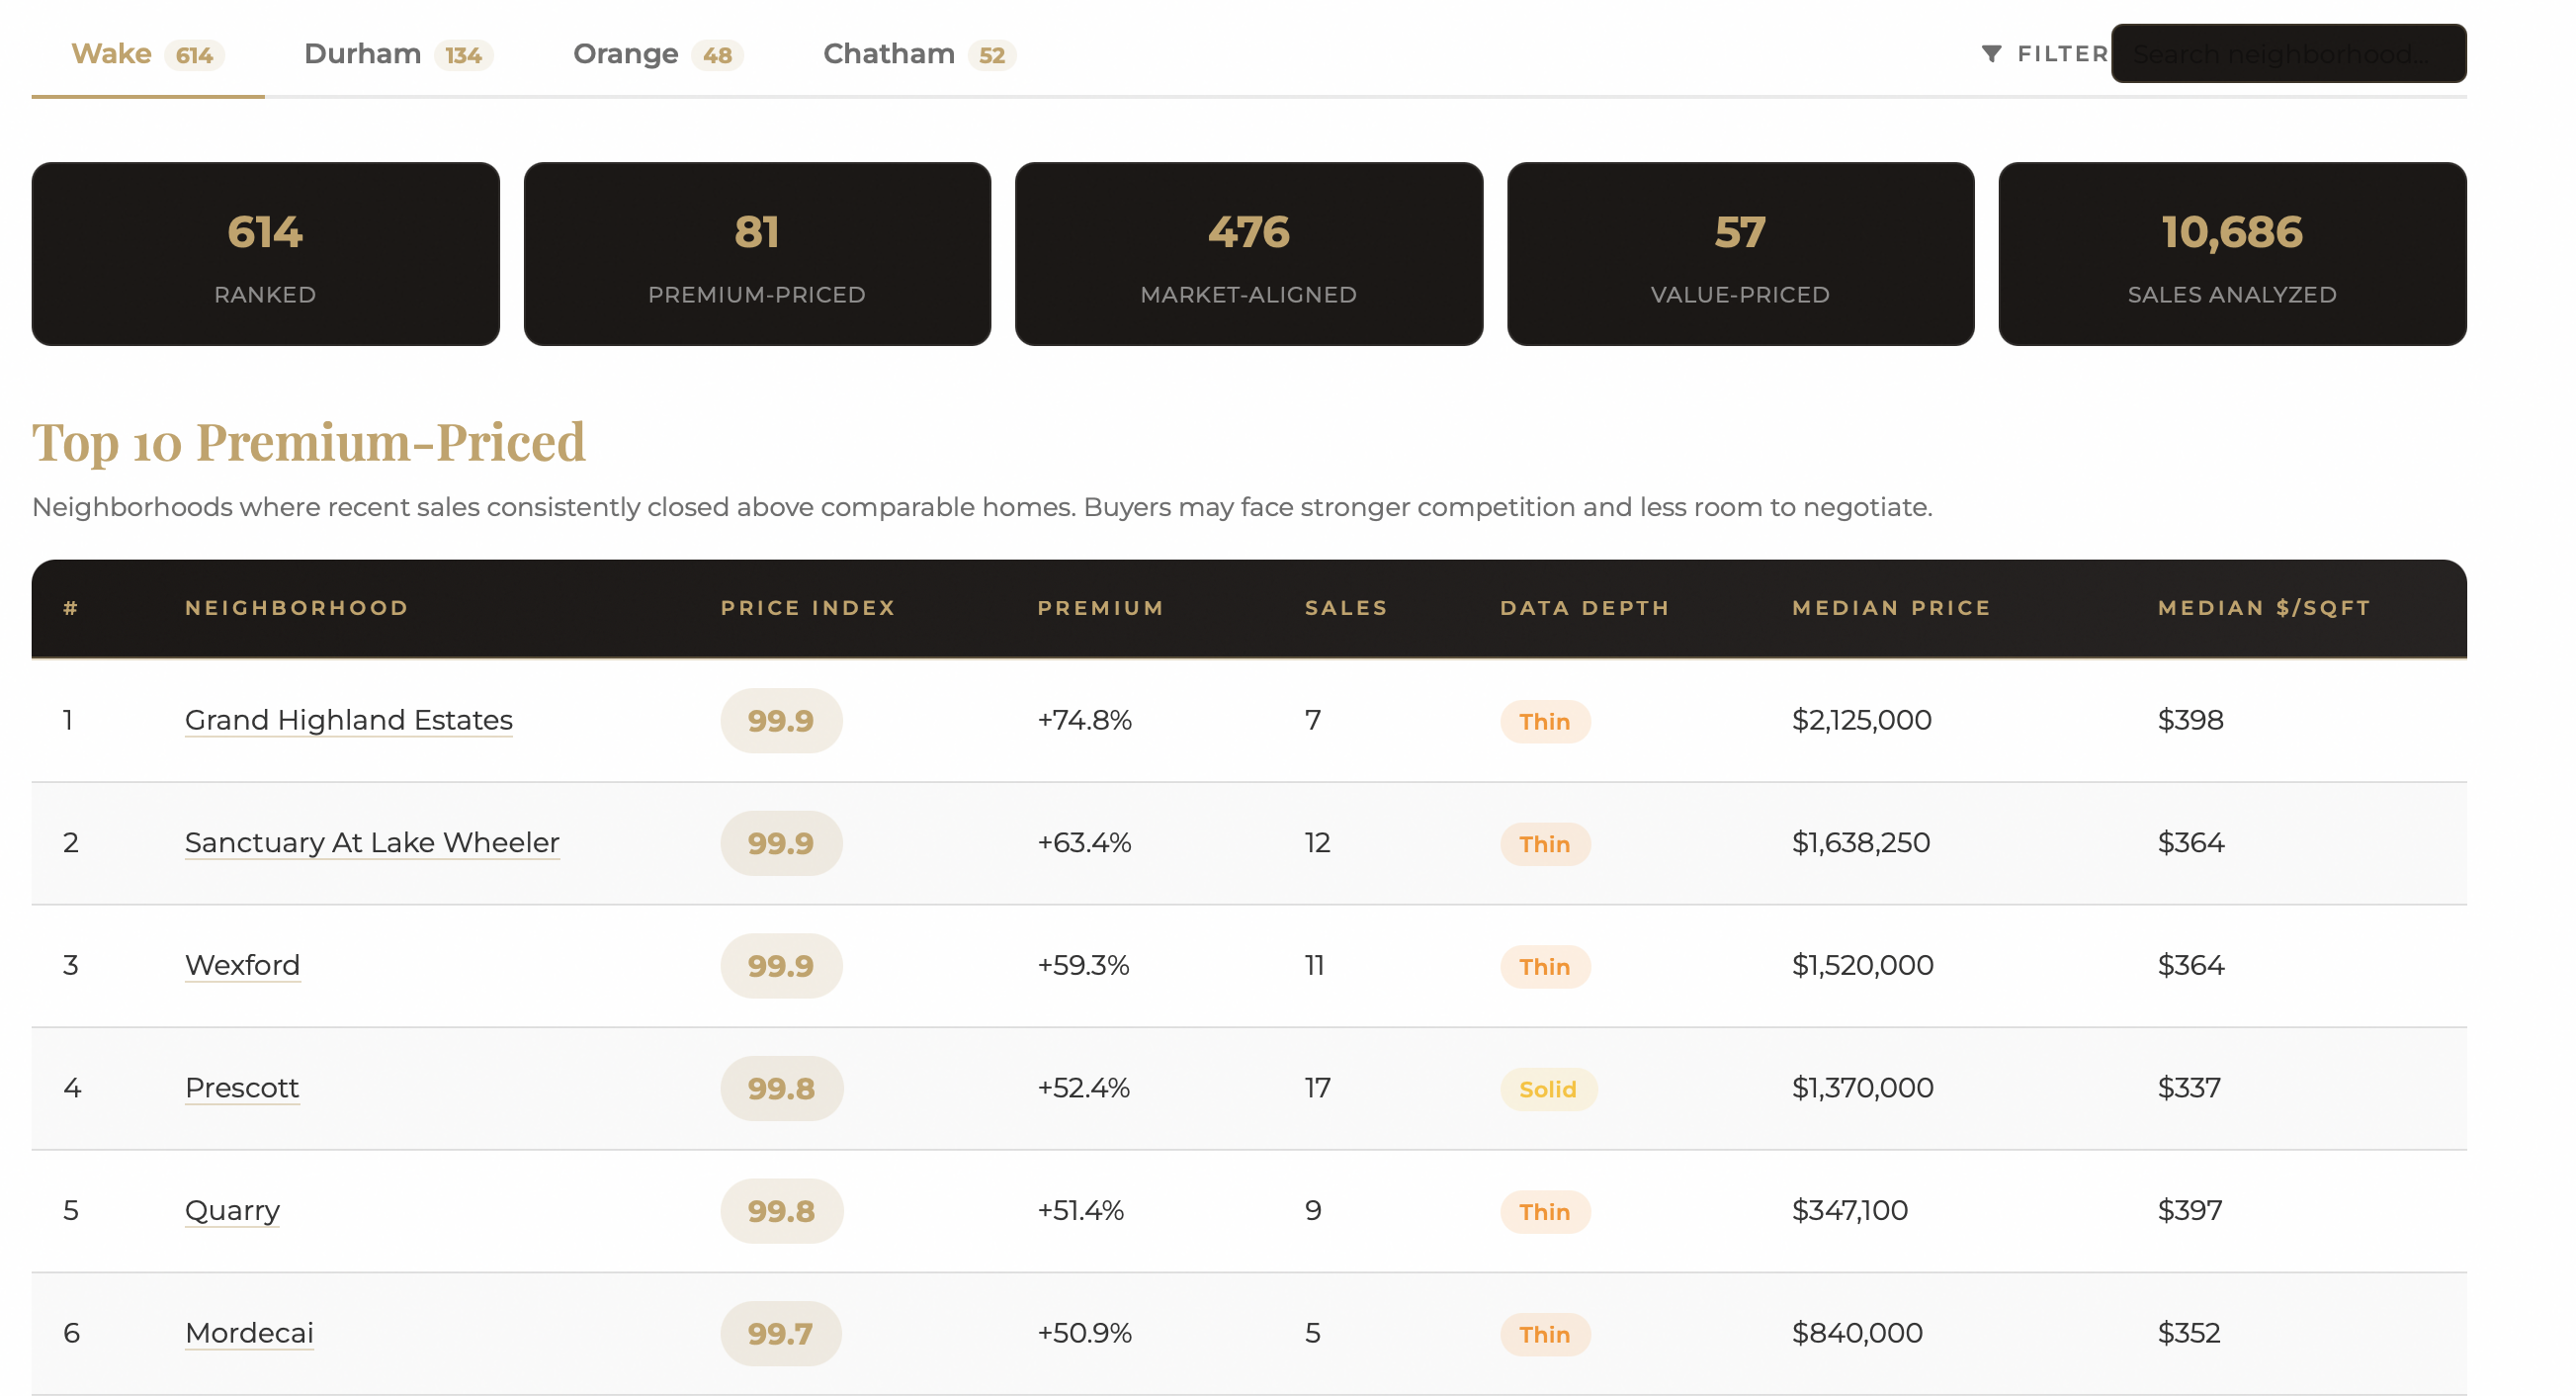
- Price Index classification (Premium, Market-Aligned, or Value-Priced) based on our statistical pricing model
- Market Momentum score — a composite of appreciation, sales volume, and emerging market signals
- Estimated annual tax based on actual county rates and assessment ratios
A Mortgage Calculator That Uses Real Data
Forget generic mortgage calculators. Our Mortgage Calculator pulls live interest rates from the Federal Reserve (FRED), uses actual county tax assessments, and knows your neighborhood's appreciation trends.
Search by address and we'll pre-fill everything from the county's parcel data — assessed value, estimated market value, tax rate. Or search by neighborhood and we'll use median pricing from recent sales.
Beyond the basics, the calculator includes:
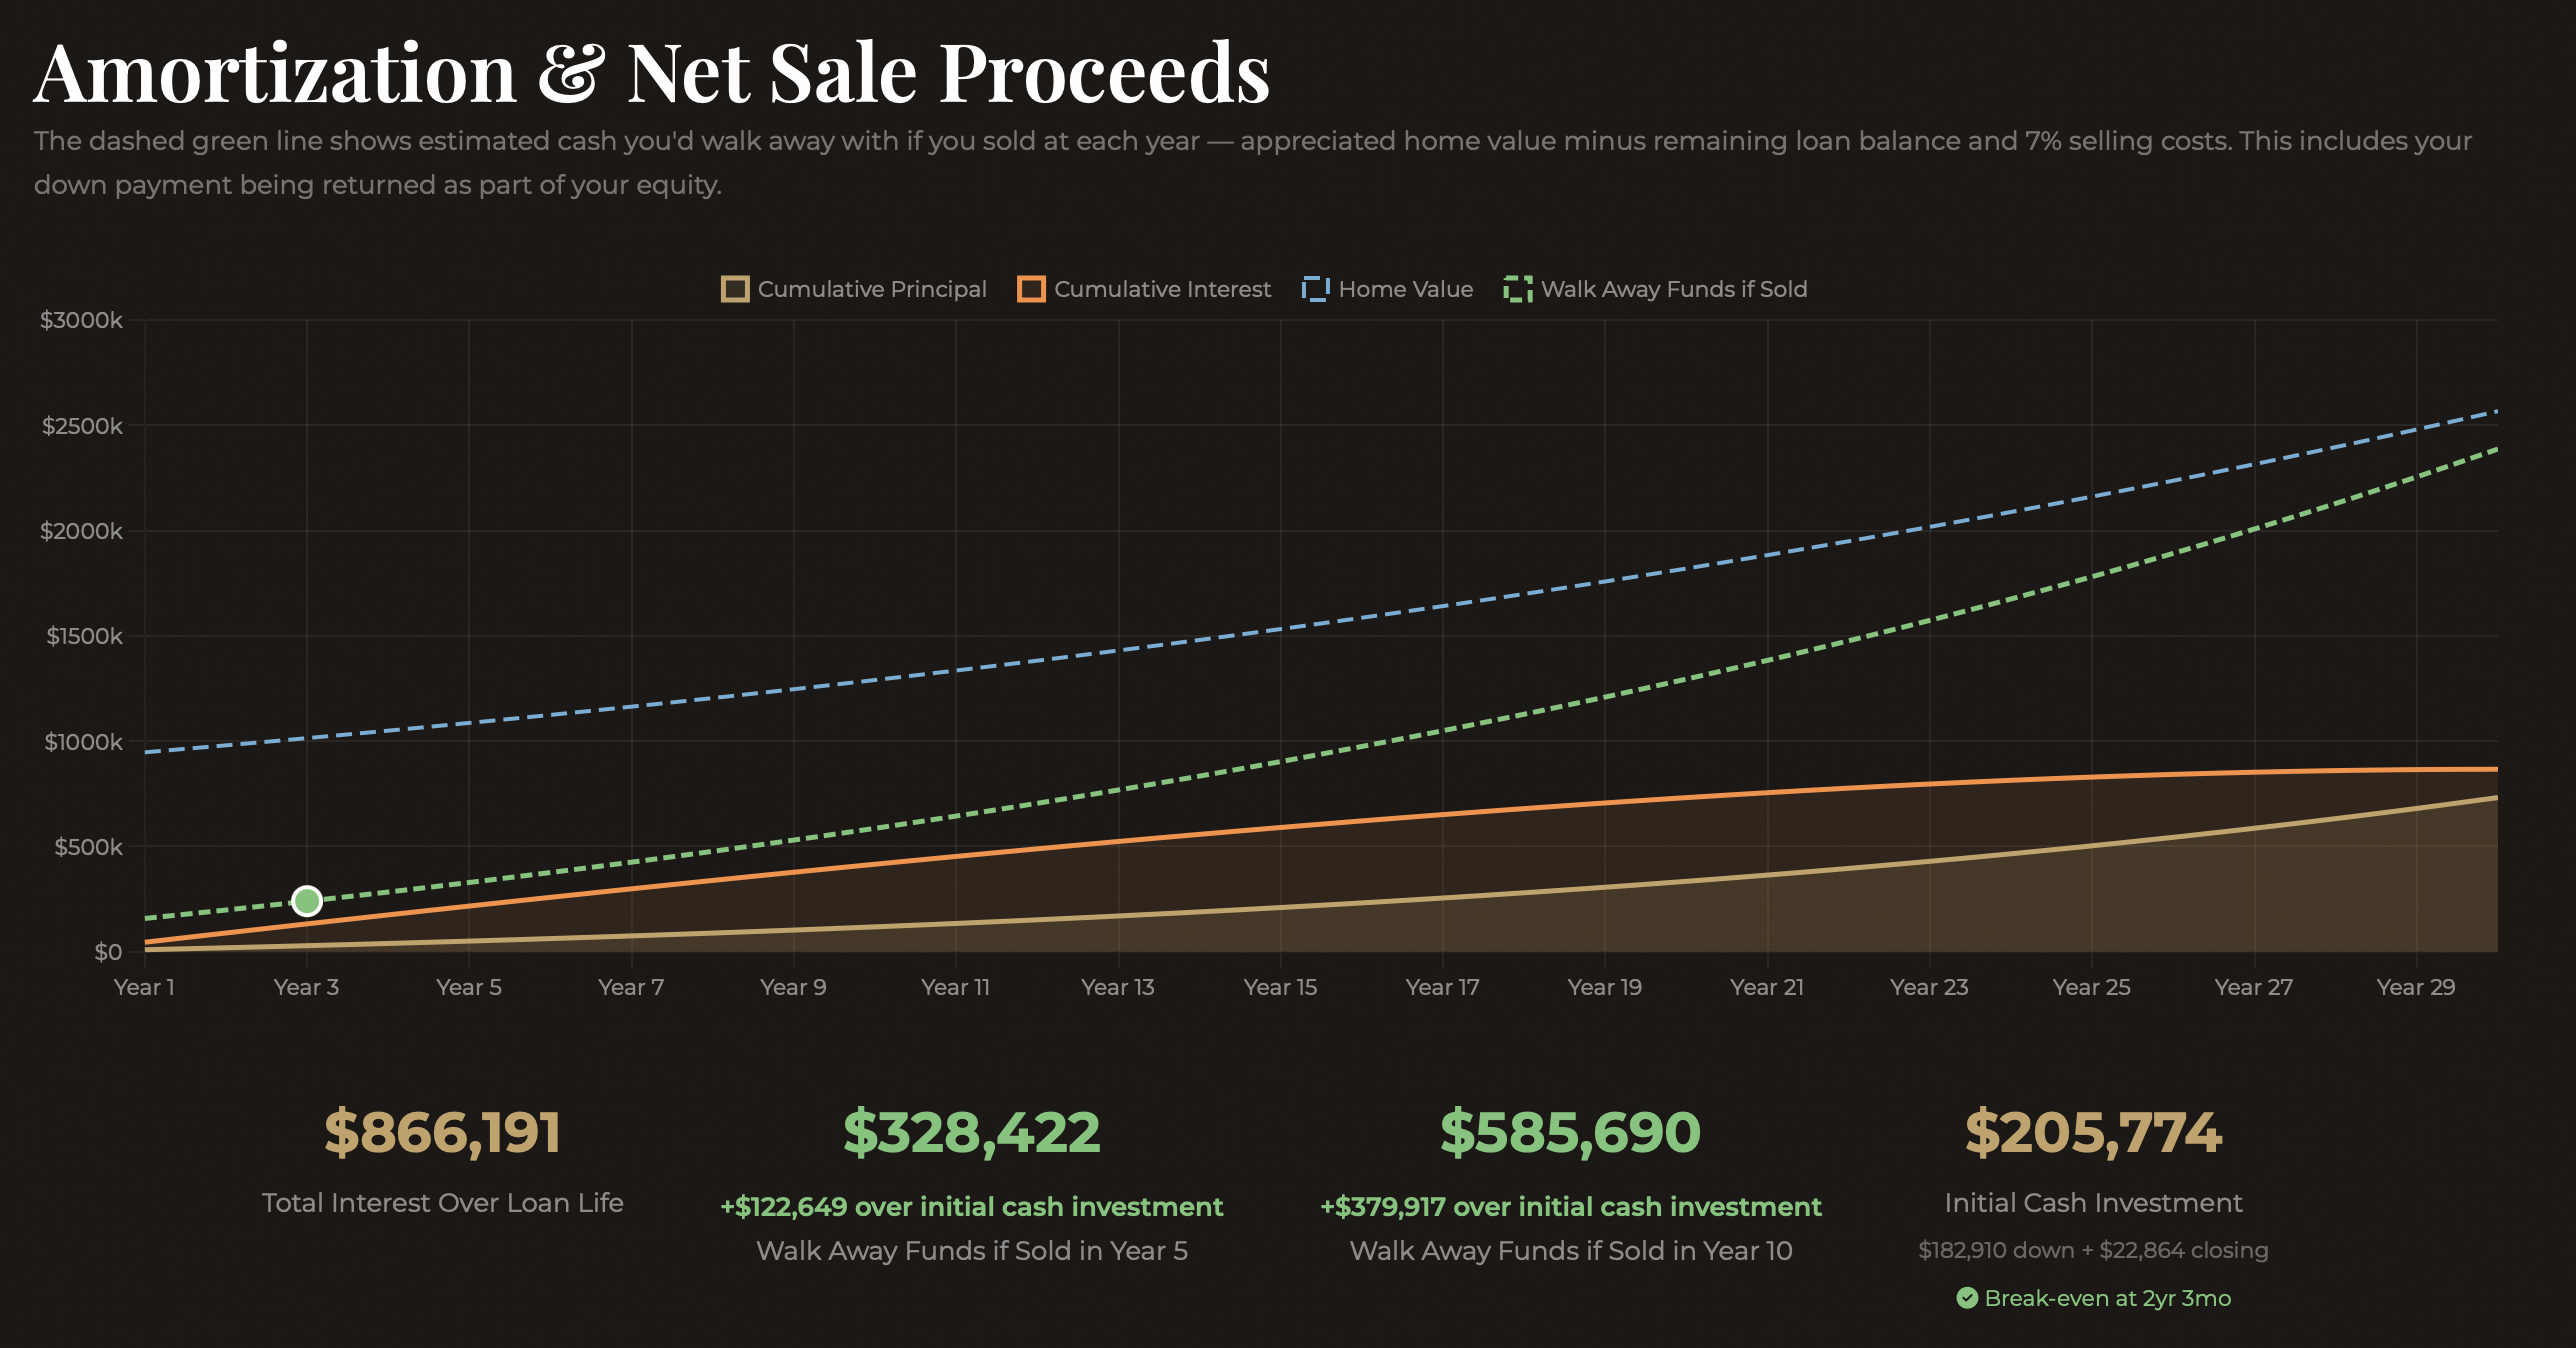
- Walk Away Funds — see what you'd take home if you sold at Year 5 or Year 10, including a break-even analysis against your initial cash investment
- Extra Payment Impact — see how much time and interest you save by paying extra each month
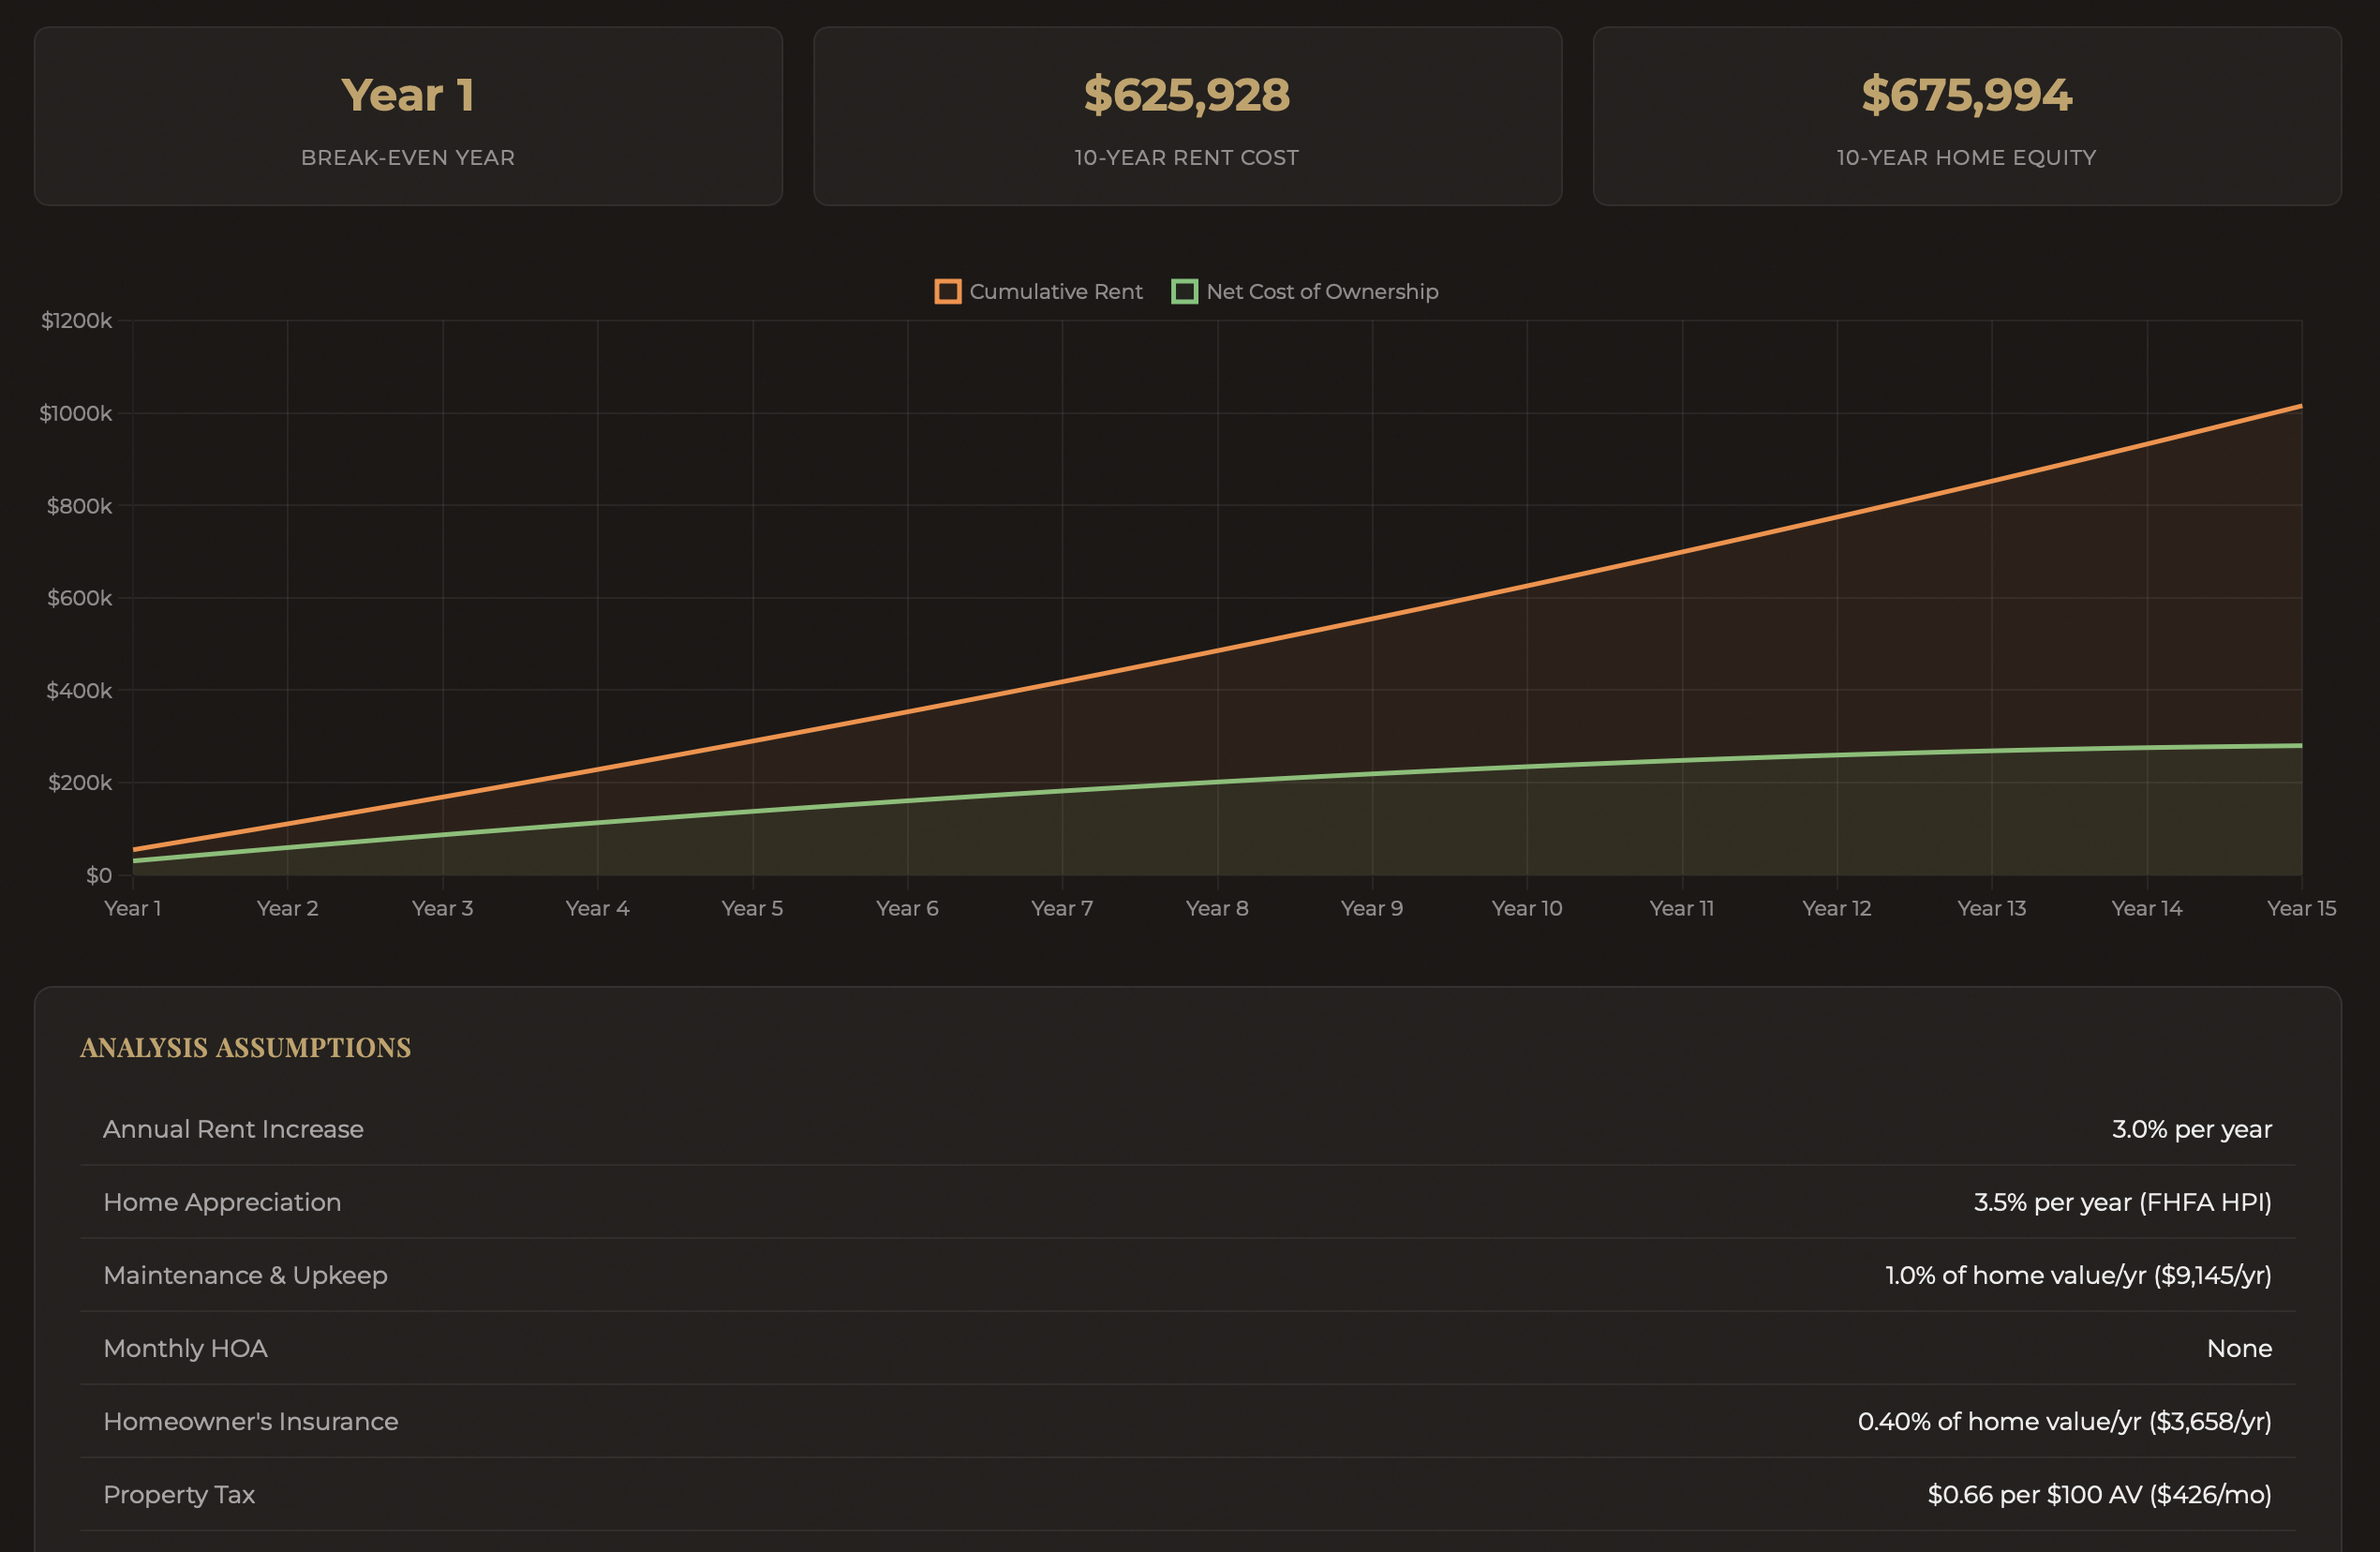
- Rent vs. Buy Analysis — with auto-estimated rent based on local market data and 1% annual maintenance
- Scenario Comparison — 15-year vs. 30-year and 10% vs. 20% down, side-by-side
- Rate Sensitivity — how your payment changes if rates move up or down
- PDF Export — download a branded report to share with your lender or partner
Market Intelligence That Rivals Institutional Research
Our Triangle Market Report tracks county-wide trends across all four counties — median prices, sales volume, price distributions, and zip code rankings. Updated weekly from live data.
But we go further with specialized reports:
- Neighborhood Price Index — a statistical pricing model that classifies every neighborhood as Premium, Market-Aligned, or Value-Priced
- Market Momentum — which neighborhoods are heating up or cooling down, scored on a 0-100 composite
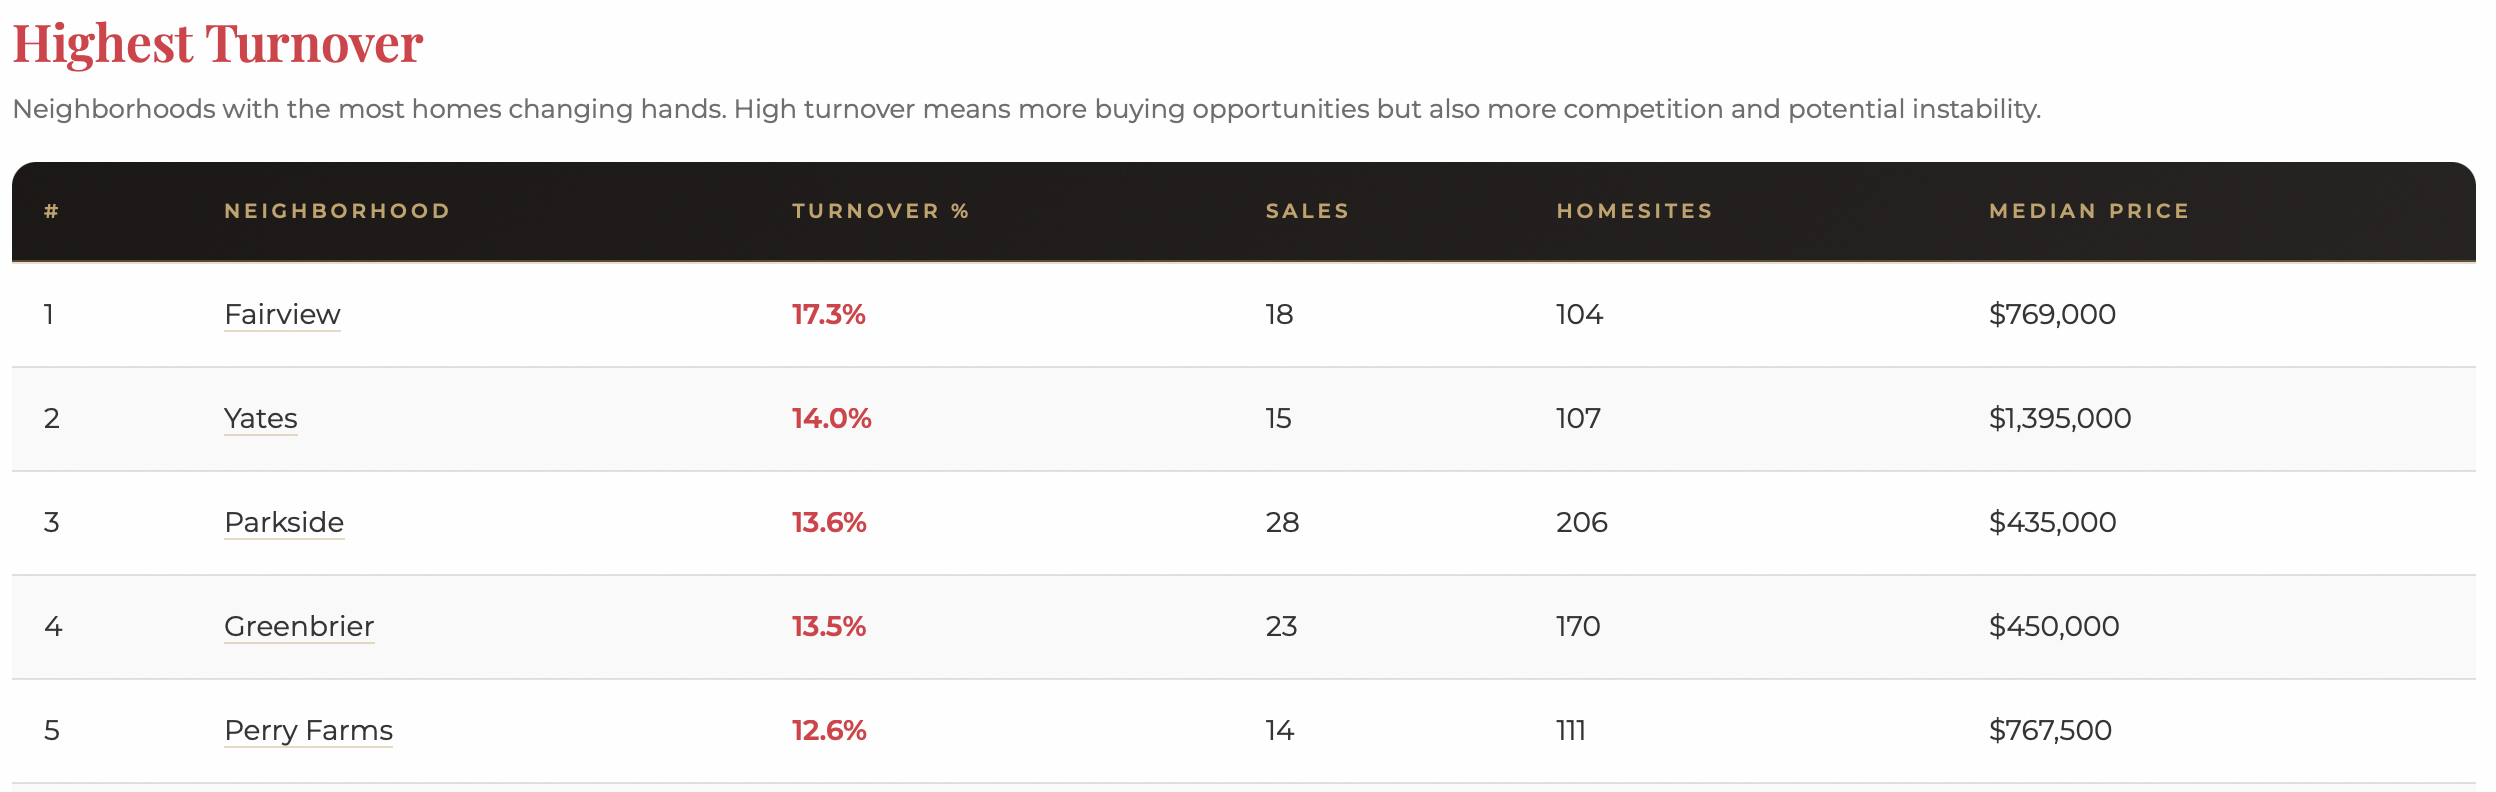
- Turnover Analysis — annual turnover rates showing which neighborhoods have the most activity
- New Construction Tracker — building permit activity across Wake and Durham counties
- Top Sales — the most expensive home sales in each county over the last 90 days
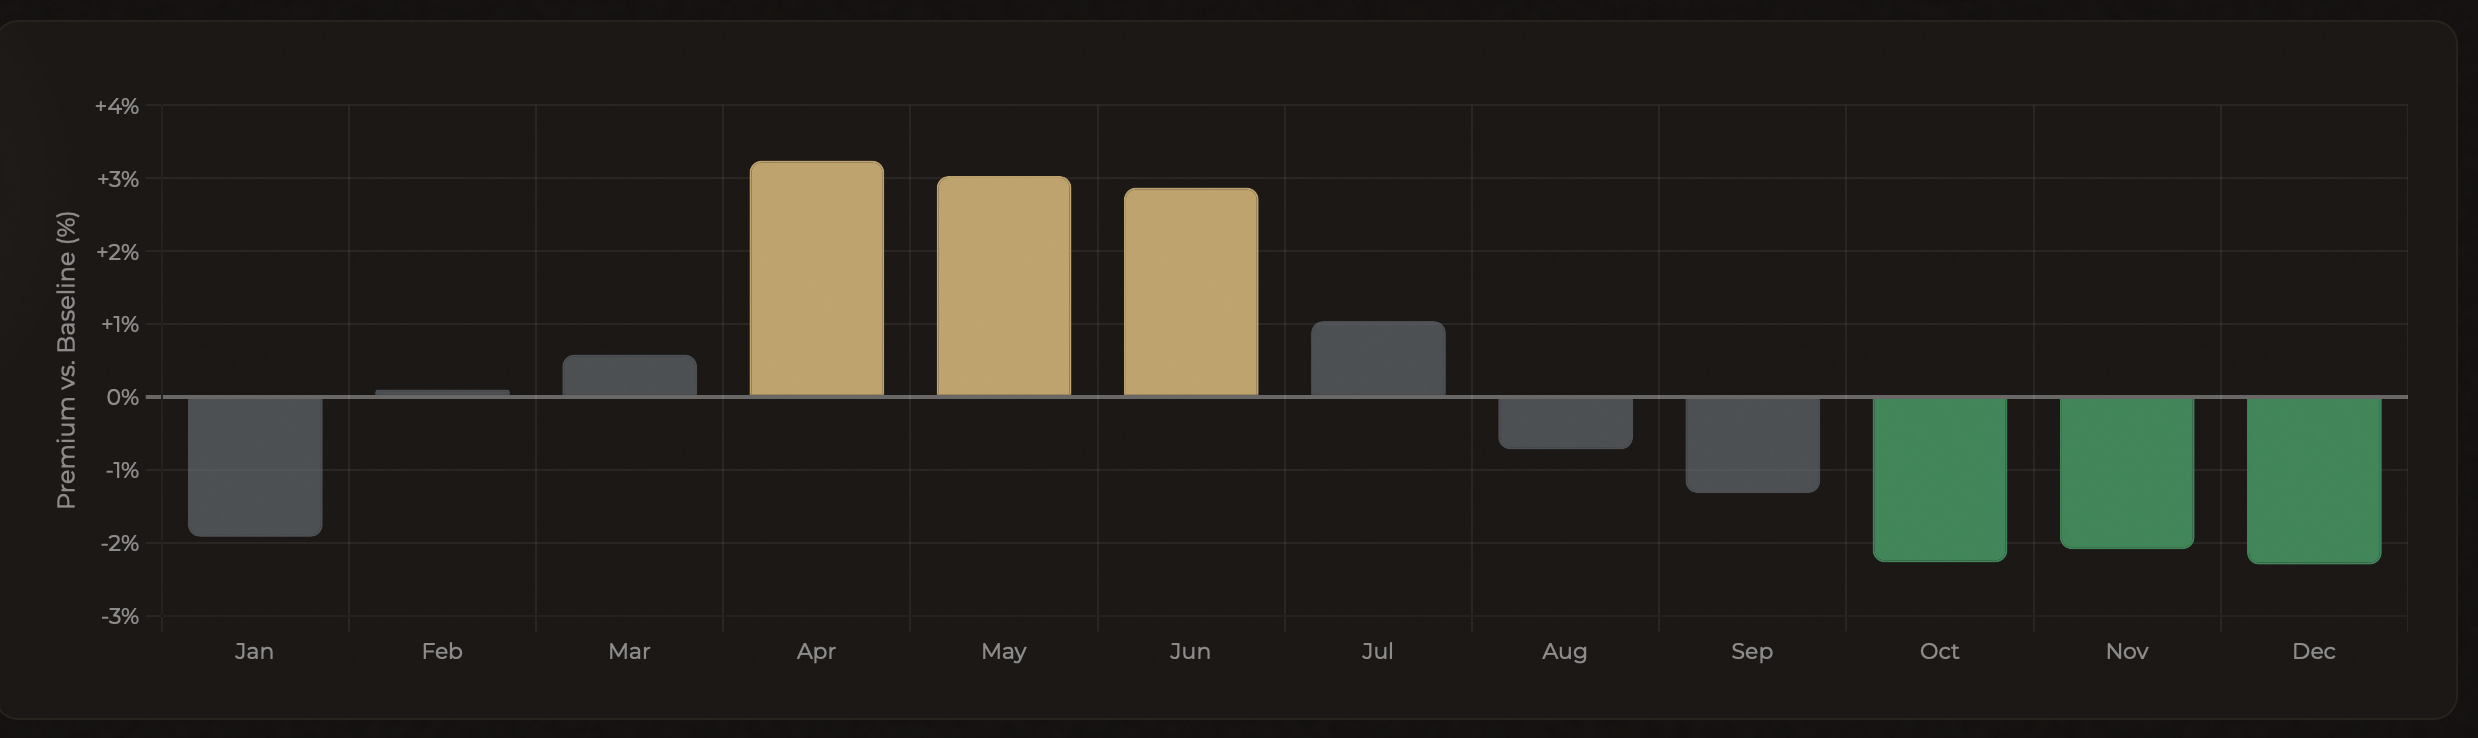
- Seasonal Timing Guide — month-by-month pricing patterns to help you time your purchase or sale
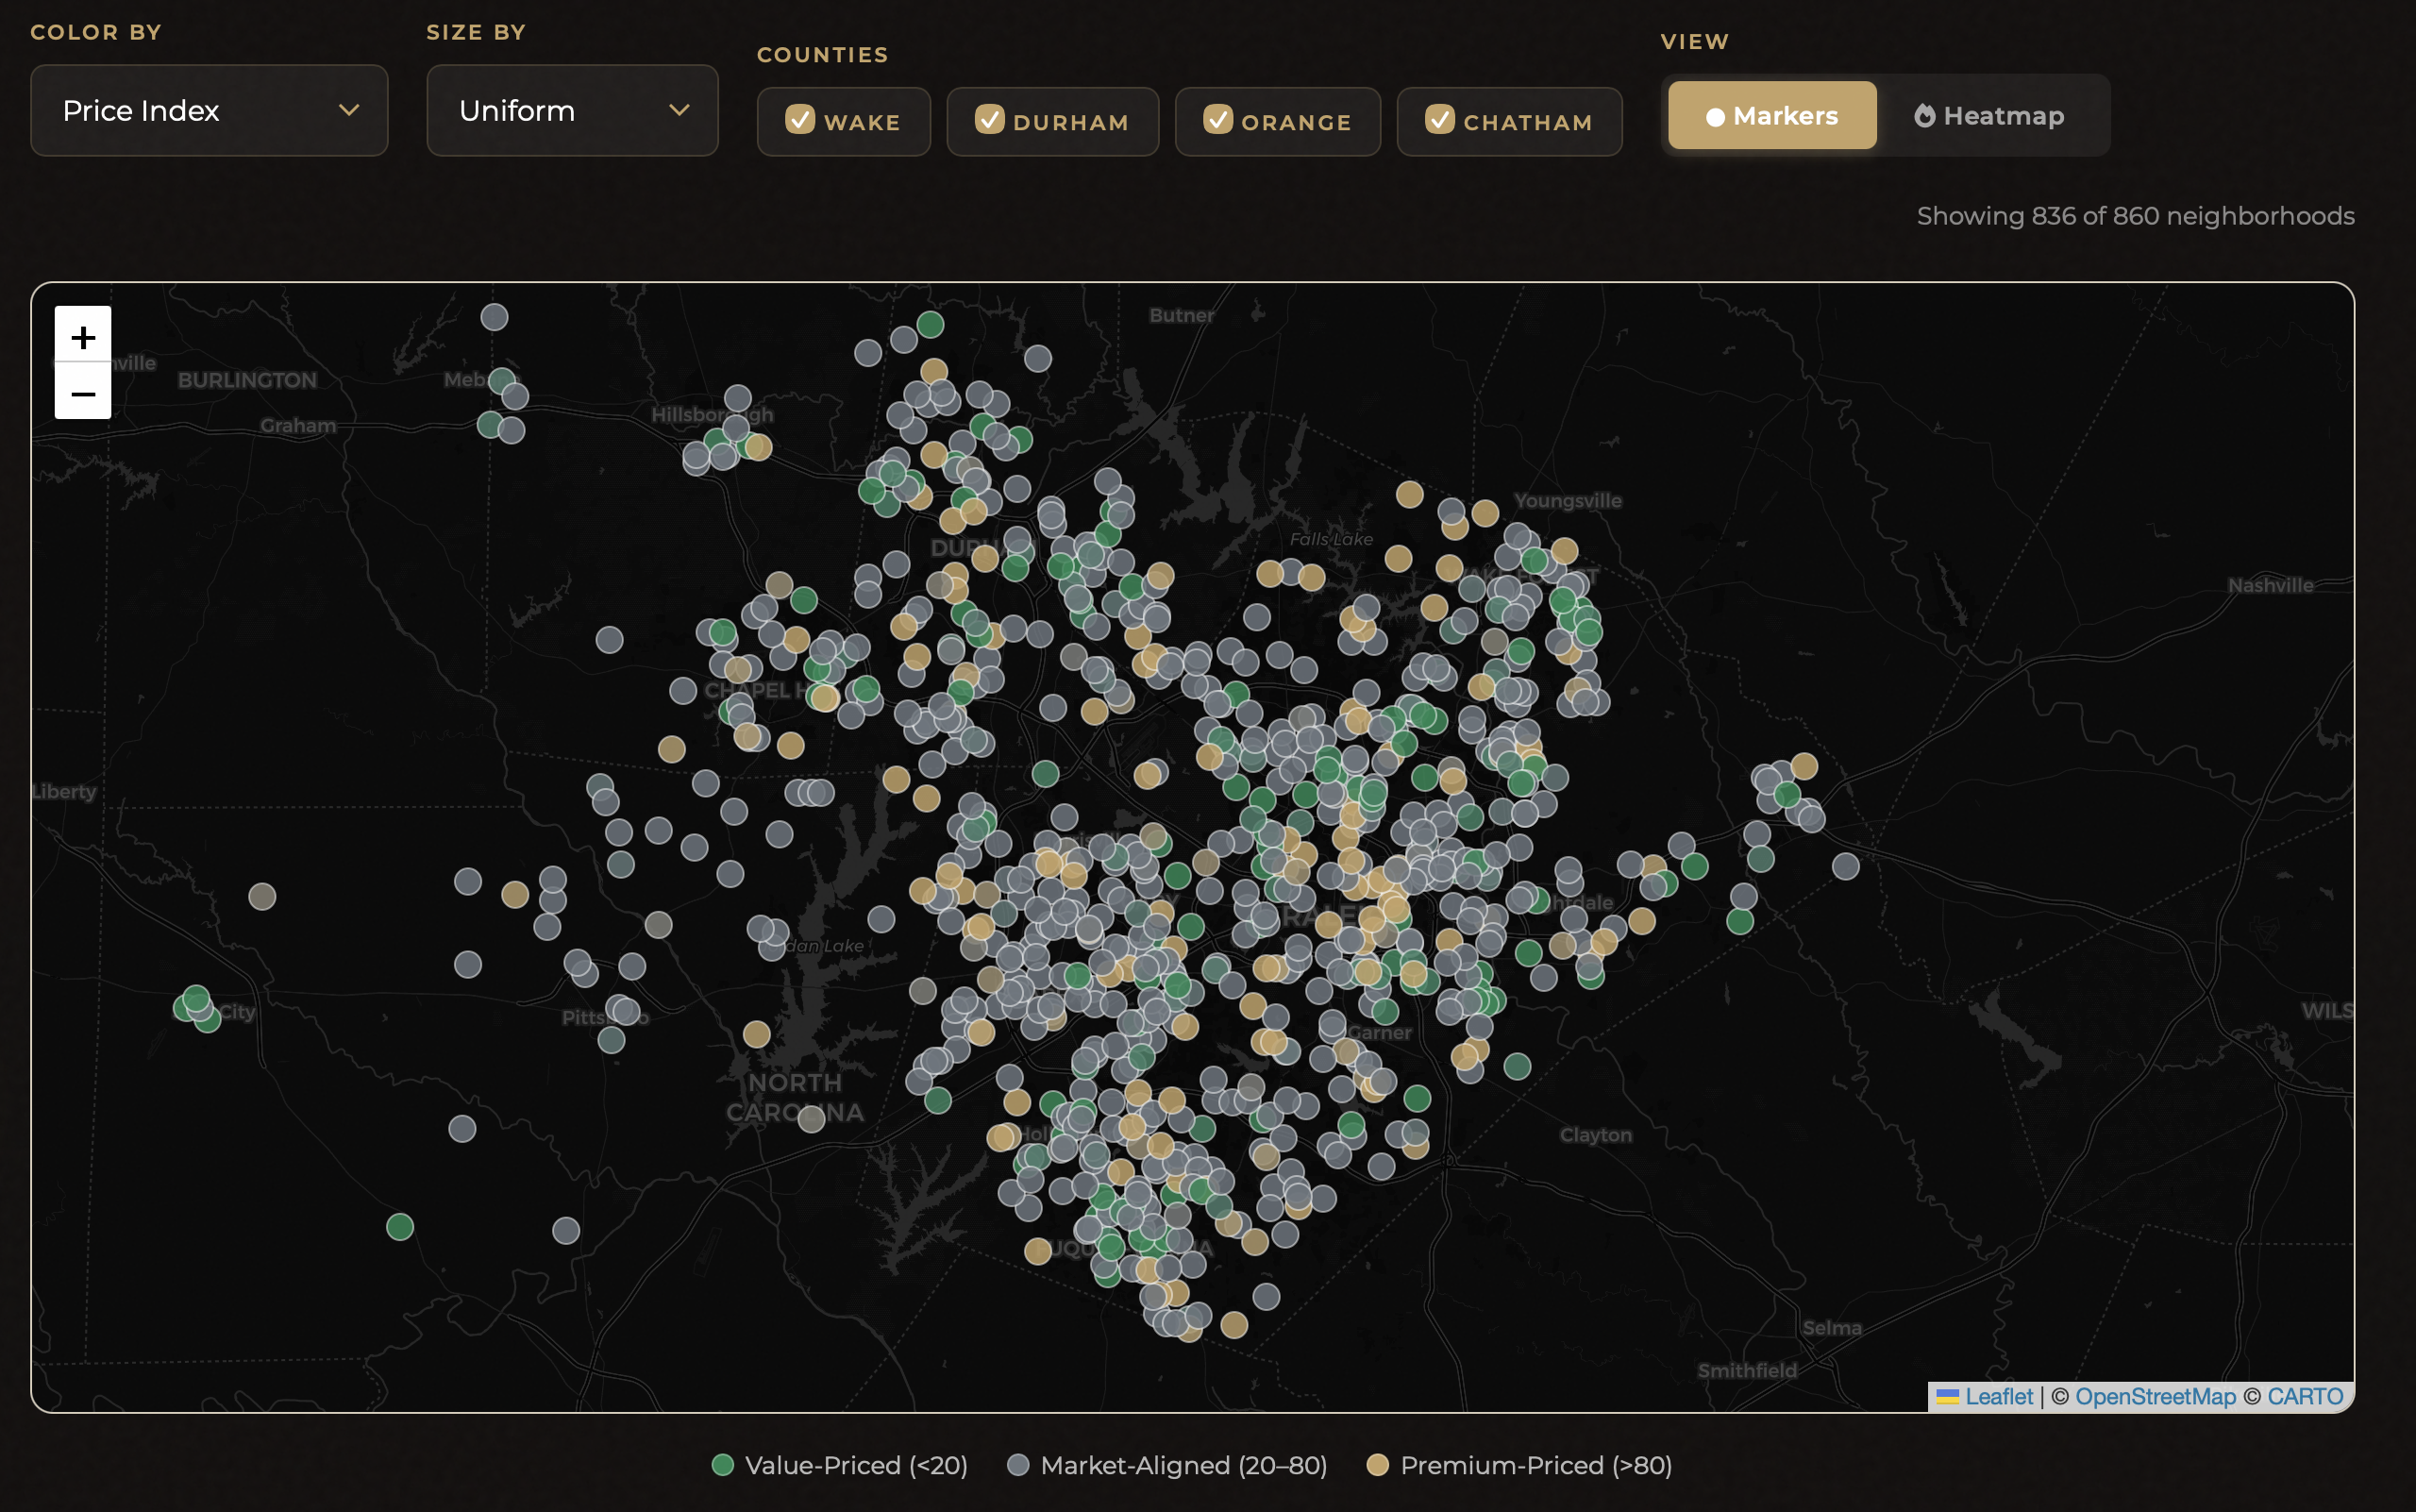
- Interactive Market Map — explore neighborhoods visually, color-coded by price, momentum, or turnover
 >
>
Current Mortgage Rates with Market Context
Our Mortgage Rates page doesn't just show you today's rates. It shows you why they are where they are — the 10-Year Treasury spread, Fed Funds rate, Housing Affordability Index, and how current rates compare to historical trends. Plus, localized affordability scenarios for Raleigh and Durham median-priced homes.
Built for the Triangle, By Someone Who Lives Here
This isn't a national platform that happens to cover Raleigh. Every data source, every calculation, every neighborhood name has been hand-curated for Wake, Durham, Orange, and Chatham counties.
Our data comes directly from:
- Wake, Durham, Orange, and Chatham County ArcGIS public record systems
- Federal Reserve Economic Data (FRED) — mortgage rates, Treasury yields, housing indices
- FHFA House Price Index — long-term appreciation trends
- US Census Bureau — demographics and community profiles
- NC Department of Public Instruction — school performance data
Free to Use. No Strings Attached.
Everything on this site is free. No paywalls. No mandatory sign-ups to see data. No bait-and-switch lead capture forms. Create an account if you want weekly email reports delivered to your inbox, but every report, every search, every tool is available to everyone.
We built this because we believe informed buyers and sellers make better decisions — and better decisions lead to better outcomes for everyone. Whether you're buying your first home, selling to upgrade, or evaluating an investment property, we want you to have the best data available.
What's Next
We're continuously improving. In the coming months, expect AI-powered neighborhood narratives, a fair price estimator, investment yield analysis, and enhanced school rankings. Explore the site. Run the numbers. Compare neighborhoods. And when you're ready to make a move, we're here to help.
Stay Updated
Get notified when we publish new posts about Triangle real estate.